Introduction to Japanese Candlestick Charting
Japanese candlesticks, a popular charting technique in financial markets, provide traders and investors with visual representations of price movements over specific time frames. Originating in Japan in the 18th century, the methodology was developed by rice traders who sought to gain insights into market behaviors. Today, Japanese candlestick charting is recognized globally, serving as a fundamental tool in technical analysis.
Unlike traditional bar charts, which only depict opening, closing, high, and low prices, Japanese candlesticks offer a more comprehensive picture of market sentiment. Each candlestick represents four crucial price points: the open, the close, the high, and the low. This combination of data not only illustrates price movements but also indicates market psychology by showcasing whether buyers or sellers were in control during a particular period.
Understanding how to read Japanese candlesticks like a professional involves recognizing the patterns and formations that emerge from these individual candlesticks. Different arrangements signal various market trends, reversals, and continuations. Traders who adeptly interpret these signals can make informed decisions, improving their chances of success in the financial markets. Learning to read these candlestick patterns can significantly enhance trading strategies.
Moreover, the significance of candlestick charting transcends simple price observation. It encapsulates the emotional undercurrents influencing the market, providing insights into trader psychology. Therefore, mastering this technique is essential for anyone serious about trading or investing. As one delves deeper into Japanese candlesticks, as discussed on platforms like mmangla.com, the profound impact of this ancient method on modern financial analysis becomes apparent, positioning traders to navigate the complexities of financial markets effectively.
Understanding Candlestick Components
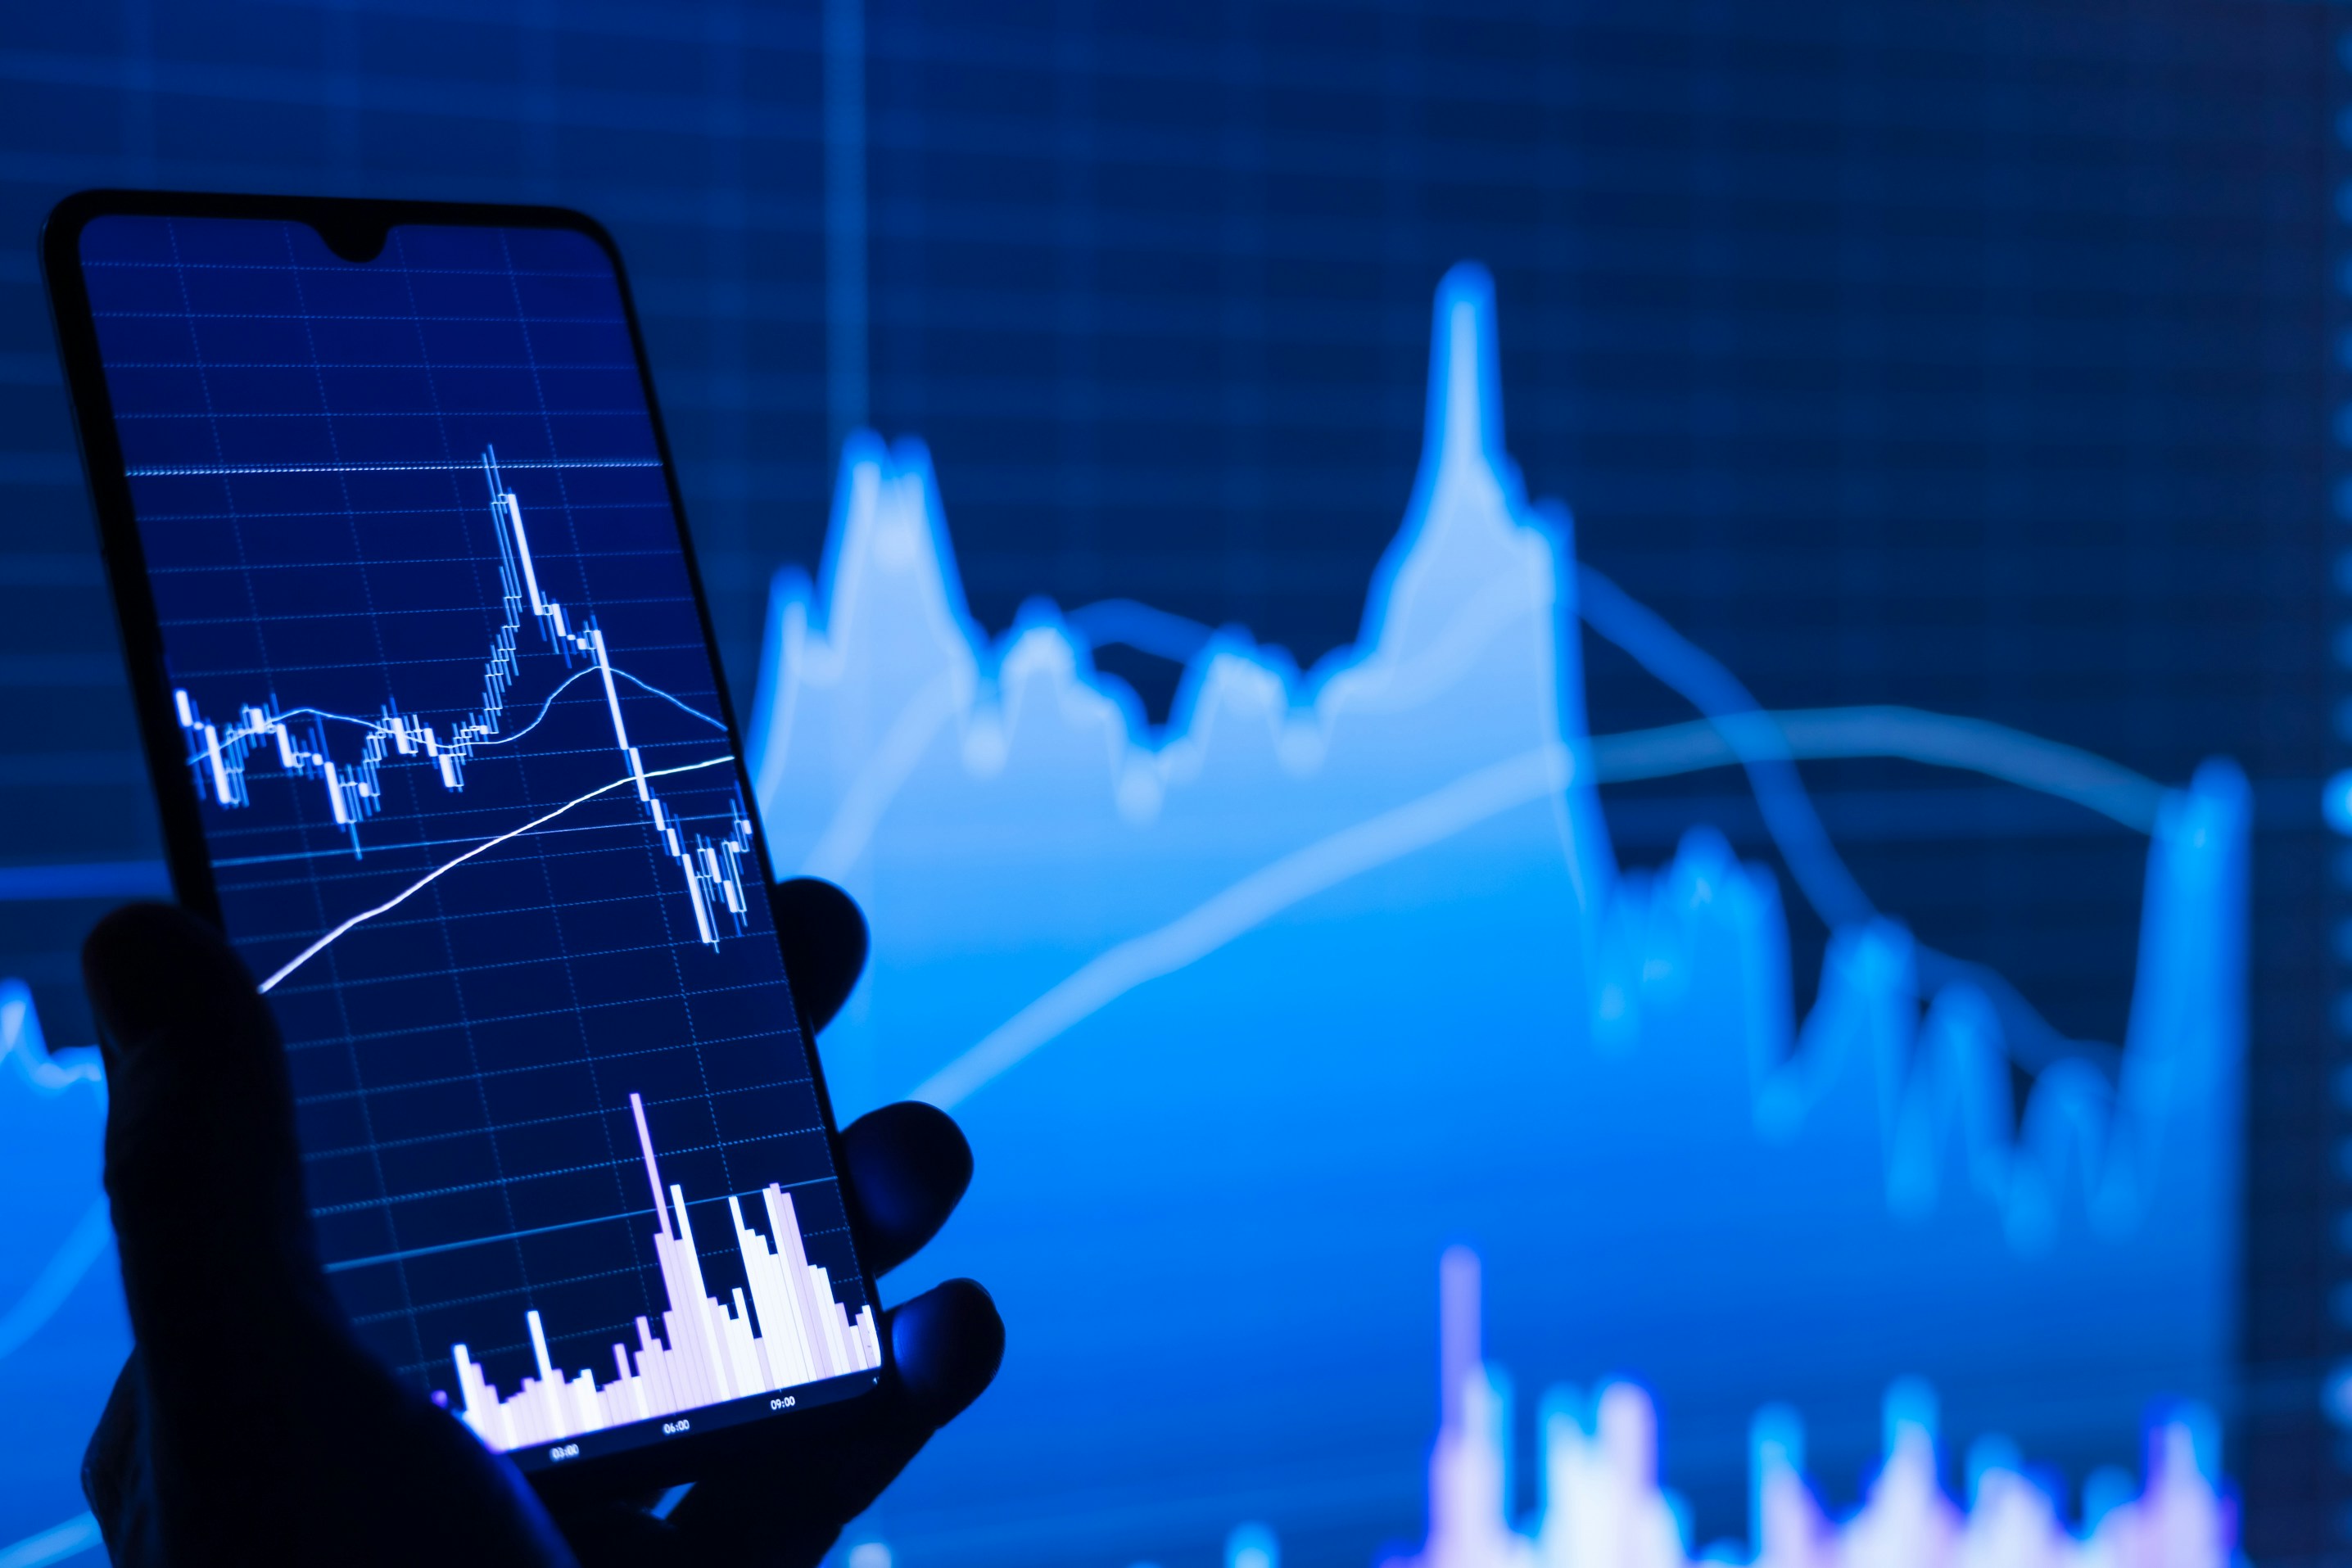
Japanese candlesticks are a powerful visual tool in financial markets, providing insights into price movements and market sentiment. To effectively learn how to read Japanese candlesticks like a professional, it is crucial to comprehend the key components that make up a candlestick. A standard candlestick consists of a body, two wicks (or shadows), and colors that represent price direction.
The body of the candlestick illustrates the difference between the opening and closing prices over a given timeframe. When the closing price is higher than the opening price, the body is typically depicted in a lighter color, indicating bullish market sentiment. Conversely, if the closing price is lower than the opening price, the body appears in a darker color, symbolizing bearish sentiment. This immediate visual representation helps traders gauge the prevailing market mood.
Next, we have the wicks or shadows, which extend above and below the body. The upper wick indicates the highest price reached during the period, while the lower wick signifies the lowest price. Together, these components provide additional context to understanding price volatility. For example, a long upper wick combined with a small body may suggest that buyers attempted to push prices higher but were ultimately overpowered by sellers, hinting at potential reversal signals.
In addition to these elements, interpreting the color and length of the candlestick offers important information about trader behavior. A long bullish candlestick generally indicates strong buying pressure, while a long bearish candlestick signals high selling pressure. Recognizing these patterns is essential for anyone seeking to learn how to read Japanese candlesticks like a professional, as they enable traders to make informed decisions based on market trends and reversals.
Common Candlestick Patterns and Their Interpretations
Understanding how to read Japanese candlesticks like a professional involves recognizing and interpreting various candlestick patterns. Several key patterns have emerged as essential for traders looking to refine their strategies and enhance their market analysis. Among them are dojis, hammers, engulfing patterns, and shooting stars, each with unique implications for market direction.
First, the doji is characterized by a lack of price movement during a specific period, resulting in a candlestick with a very small body. It indicates market indecision, where buyers and sellers are in equilibrium, and can signal potential reversals in trends. When traders spot a doji, they should look at subsequent candles for confirmation before making any decisive moves.
Next, the hammer candlestick pattern, which appears after a downtrend, suggests that buyers are gaining strength. Its formation consists of a small body at the upper end of the trading range and a long lower shadow. This pattern often signals a potential reversal to the upside, making it crucial for traders to act accordingly.
Another significant pattern is the engulfing pattern. This occurs when a small candlestick is followed by a larger opposite one, which engulfs the previous candle’s body. A bullish engulfing pattern, found at the bottom of a downtrend, indicates a strong buying interest, while a bearish engulfing pattern, seen at the end of an uptrend, suggests selling pressure. Recognizing these shifts can enhance decision-making for traders.
Lastly, the shooting star pattern, formed after a rising trend, features a small body at the lower end of the trading range with a long upper shadow. This indicates that, despite initial buying strength, sellers have come in to push prices down. As such, its presence is frequently interpreted as a potential reversal signal.
By familiarizing oneself with these common patterns, traders can better understand market movements and improve their strategies. Incorporating visual aids can further bolster the recognition of these patterns, helping readers to apply this knowledge effectively in their trading practices.
Applying Candlestick Analysis to Trading Strategies
Incorporating candlestick analysis into trading strategies is essential for any trader looking to enhance their decision-making process. The first step in effectively utilizing how to read Japanese candlesticks like a professional involves integrating candlestick patterns with other technical indicators. For instance, using moving averages alongside candlestick formations can provide a clearer picture of potential market direction. When a candlestick pattern aligns with a bullish or bearish moving average crossover, traders can gain valuable confirmation of the trend, thus improving their trade execution reliability.
Moreover, it is crucial to contextualize candlestick patterns within the broader market environment. This means understanding the market sentiment, economic indicators, and the overall trend. A pin bar might suggest a reversal, but if it appears during a strong trend, its significance declines. Therefore, traders should not rely solely on candlestick patterns but should consider accompanying factors that may influence price movements, enhancing their ability to read Japanese candlesticks like a professional.
Additionally, traders should be aware of common pitfalls when applying candlestick analysis and technical indicators. One major mistake is to become over-reliant on individual signals without considering subsequent price action. Candlestick patterns may indicate potential opportunities, yet they should always be confirmed by following price behavior. Traders must remain vigilant and avoid confirmation bias when interpreting patterns. Regular review of trade performance can also aid in refining strategies to support continuous learning and improvement.
By integrating these techniques and maintaining a disciplined approach, traders can start effectively applying candlestick analysis to their trading strategies. Resources such as mmangla.com and insights from professionals like Munawar Ahmad can provide additional guidance for traders aiming to master this analytical skill.